Real-Time CitiBike Station Anomaly Detection
Detecting operational instability and unusual activity in CitiBike stations
Inspired by the “station flipping” exploits reported in The New York Times
Situation: CitiBike operates 1,700+ docking stations across NYC, generating thousands of status updates hourly through public APIs.
Complication: Operational issues manifest as rapid oscillations—stations cycling between empty and full within minutes. These patterns indicate rebalancing failures or capacity constraints, but they’re invisible in static dashboards and disappear before daily reports capture them.
Question: How can CitiBike detect unstable stations in real time to enable faster operational response?
Answer: A real-time anomaly detection pipeline that monitors live data and flags stations exhibiting frequent empty-full transitions within configurable time windows.
Why This Solution Works
1. Detects Behavioral Instability, Not Just Low Availability
Traditional monitoring shows point-in-time status. This system identifies patterns—a station cycling between empty and full 4 times in 45 minutes signals capacity mismatch requiring intervention, not natural demand fluctuation.
2. Operates in Real Time
Station issues often emerge and resolve within 30-60 minutes. Real-time detection with rolling windows enables same-shift response rather than next-day post-mortems.
3. Maintains Interpretability
Rule-based detection with explicit thresholds (flip count, time window) means operations teams understand why stations are flagged without data science expertise. Parameters are tunable based on local knowledge.
System Architecture
Live CitiBike API → Ingestion (Go) → Feature Engineering (Go) → Anomaly Detection (Python) → Storage (MySQL) → Dashboards
Data Ingestion (internal/api/api.go)
- Polls CitiBike GBFS API for real-time station status
- Parses: bikes available, docks available, operational flags, timestamps
- Go selected for low-latency polling and concurrent processing
Feature Engineering (internal/processing/processing.go)
- Transforms raw counts into operational metrics:
- Percent filled/empty (normalizes across different station capacities)
- State classification:
empty(<10% full),full(>90% full),normal - Timestamp normalization for time-series analysis
Anomaly Detection (anomaly_detection/detect_flips.py)
- Tracks state transitions (
empty↔full) within rolling windows (default: 45 min) - Flags stations exceeding threshold (default: 3+ flips per window)
- Confirms patterns across multiple observations
Example Output:
timestamp,station_id,station_name,percent_full,state,flip_count
2025-05-08 16:00:00,29a41b09,41 St & 3 Ave,0.05,empty,4
Storage (MySQL)
- Persists station states and anomaly flags
- Enables historical analysis and BI tool integration
Demo Video
Here’s a walk-through of the anomaly detection system in action:
System Outputs
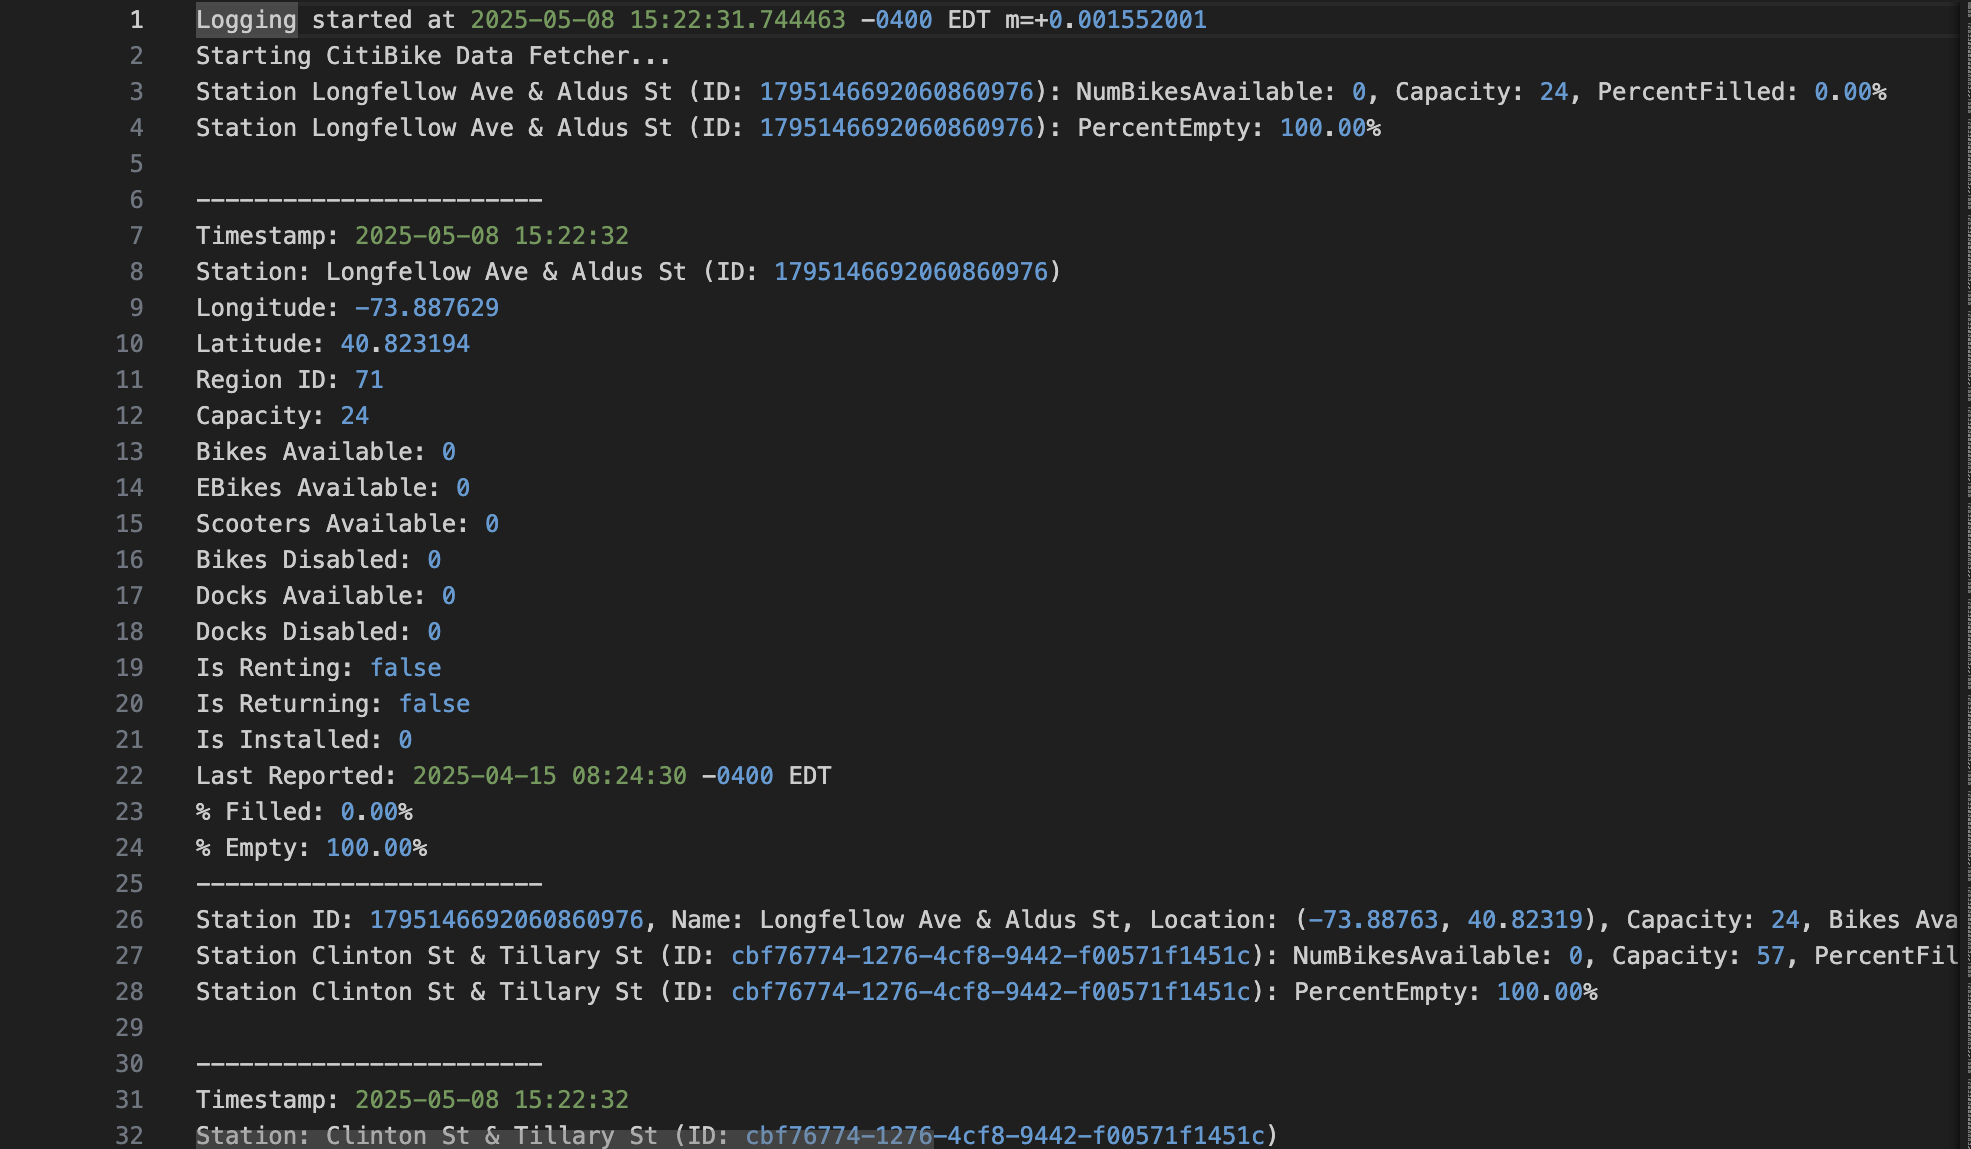
1. Raw CitiBike API Data
Data called from the CitiBike API using Go—showing live station status across the network.
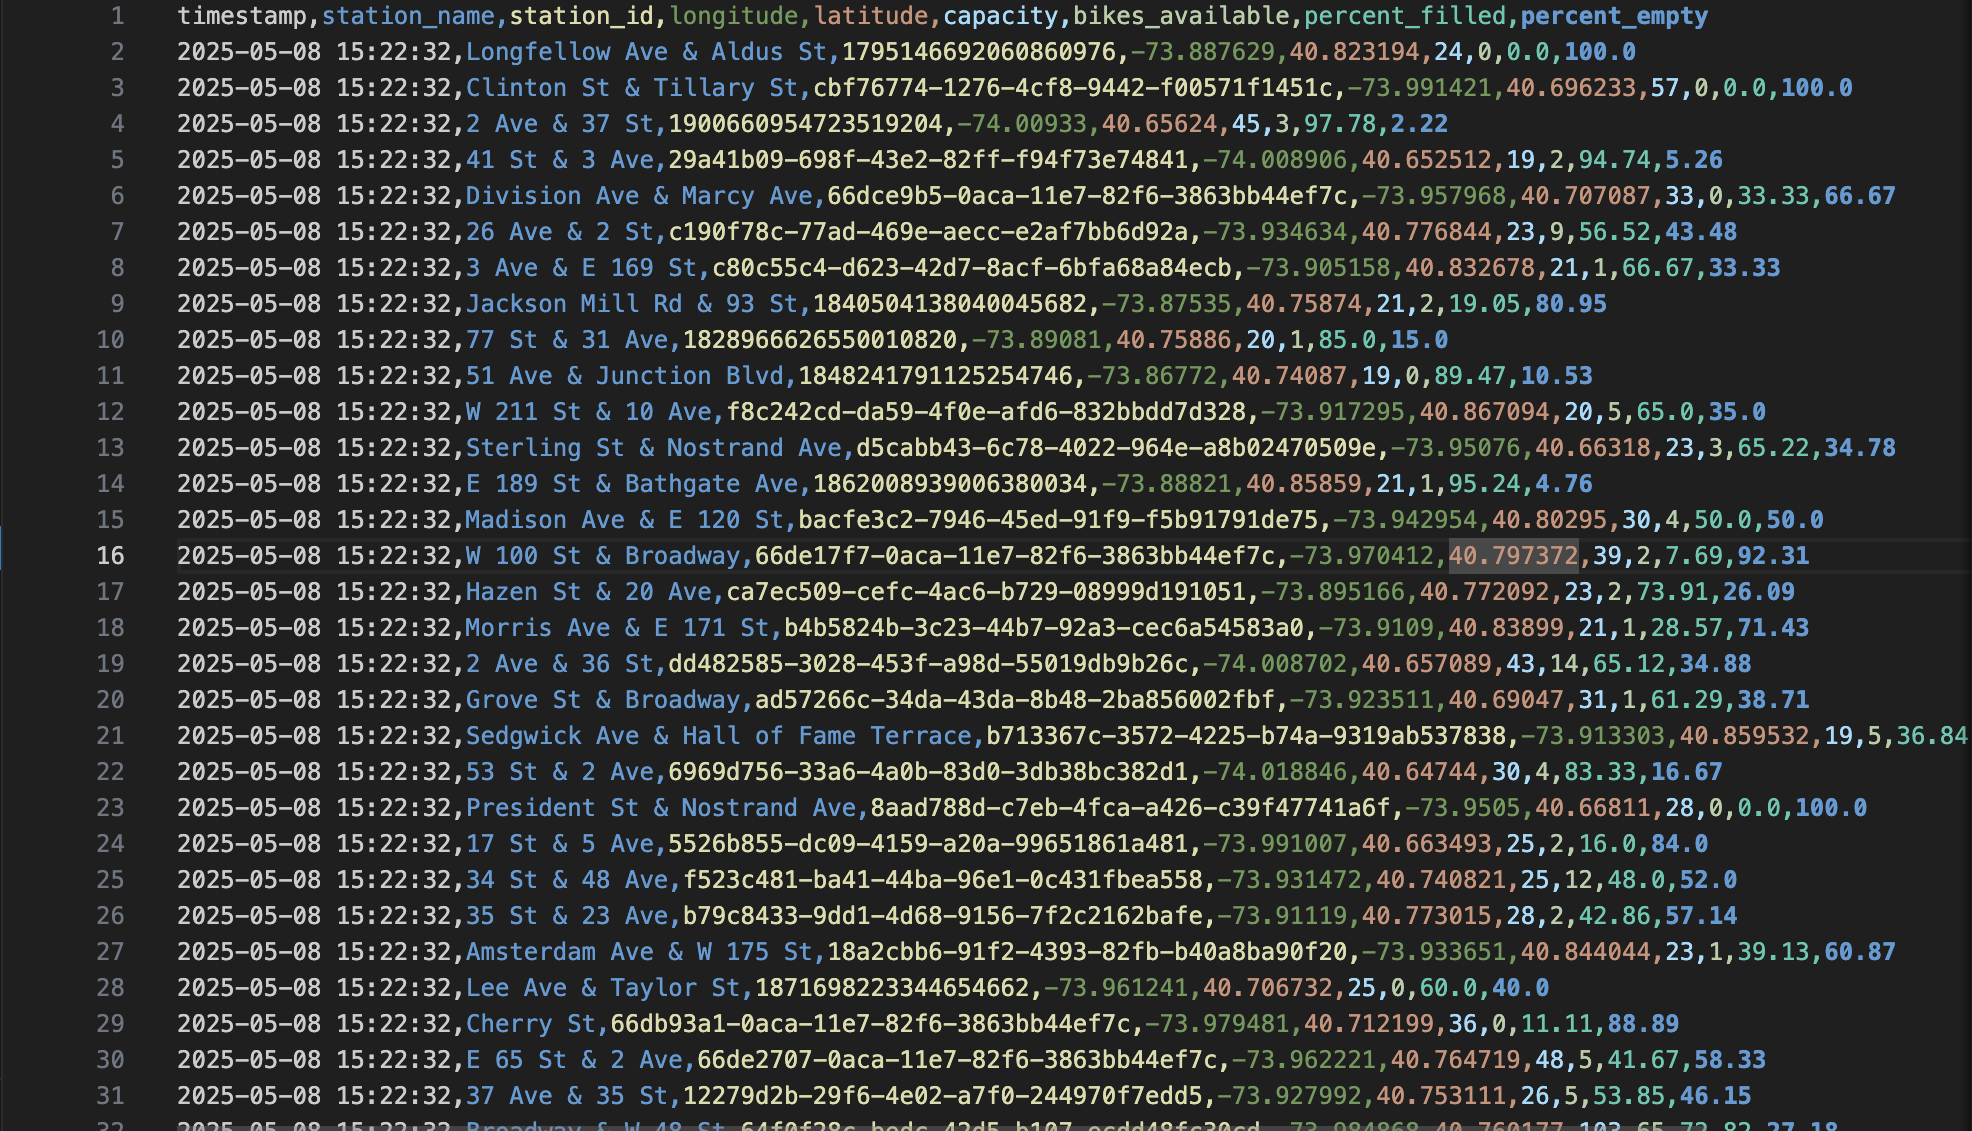
2. Feature-Enriched Data
Parsed data with engineered features like ‘percent filled’ and ‘percent empty’ added for operational analysis.
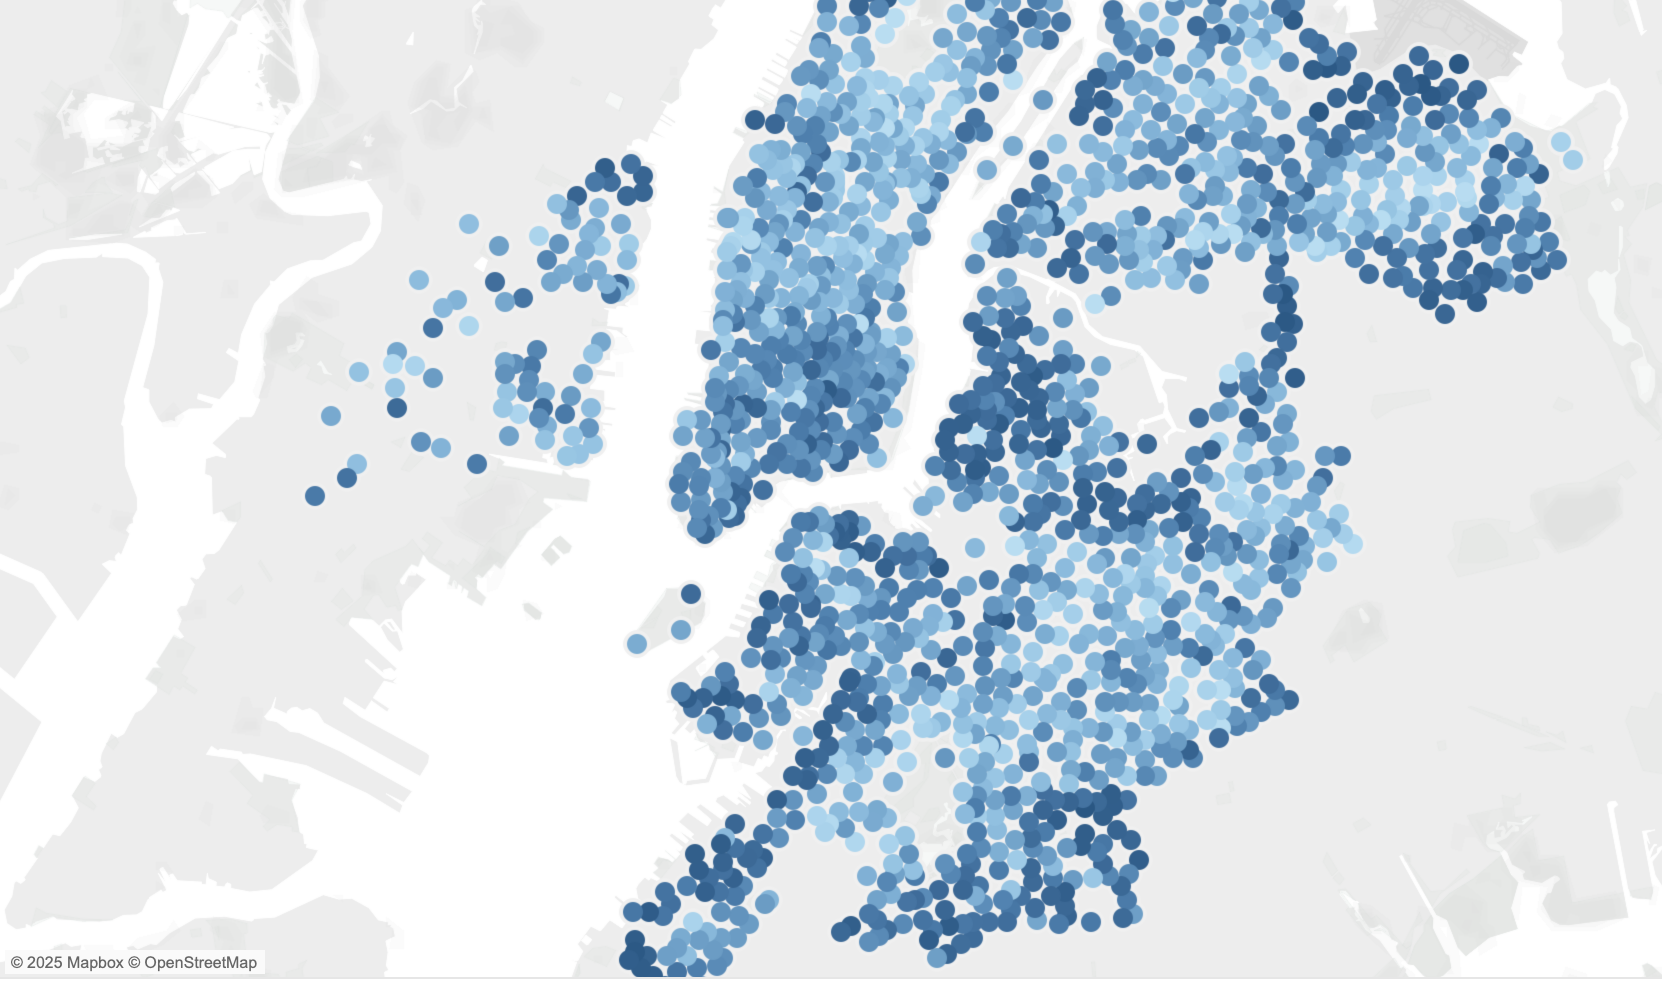
3. Station Utilization Heatmap
Geographic visualization showing how full each station is. Darker blue indicates higher utilization—stations nearing capacity.
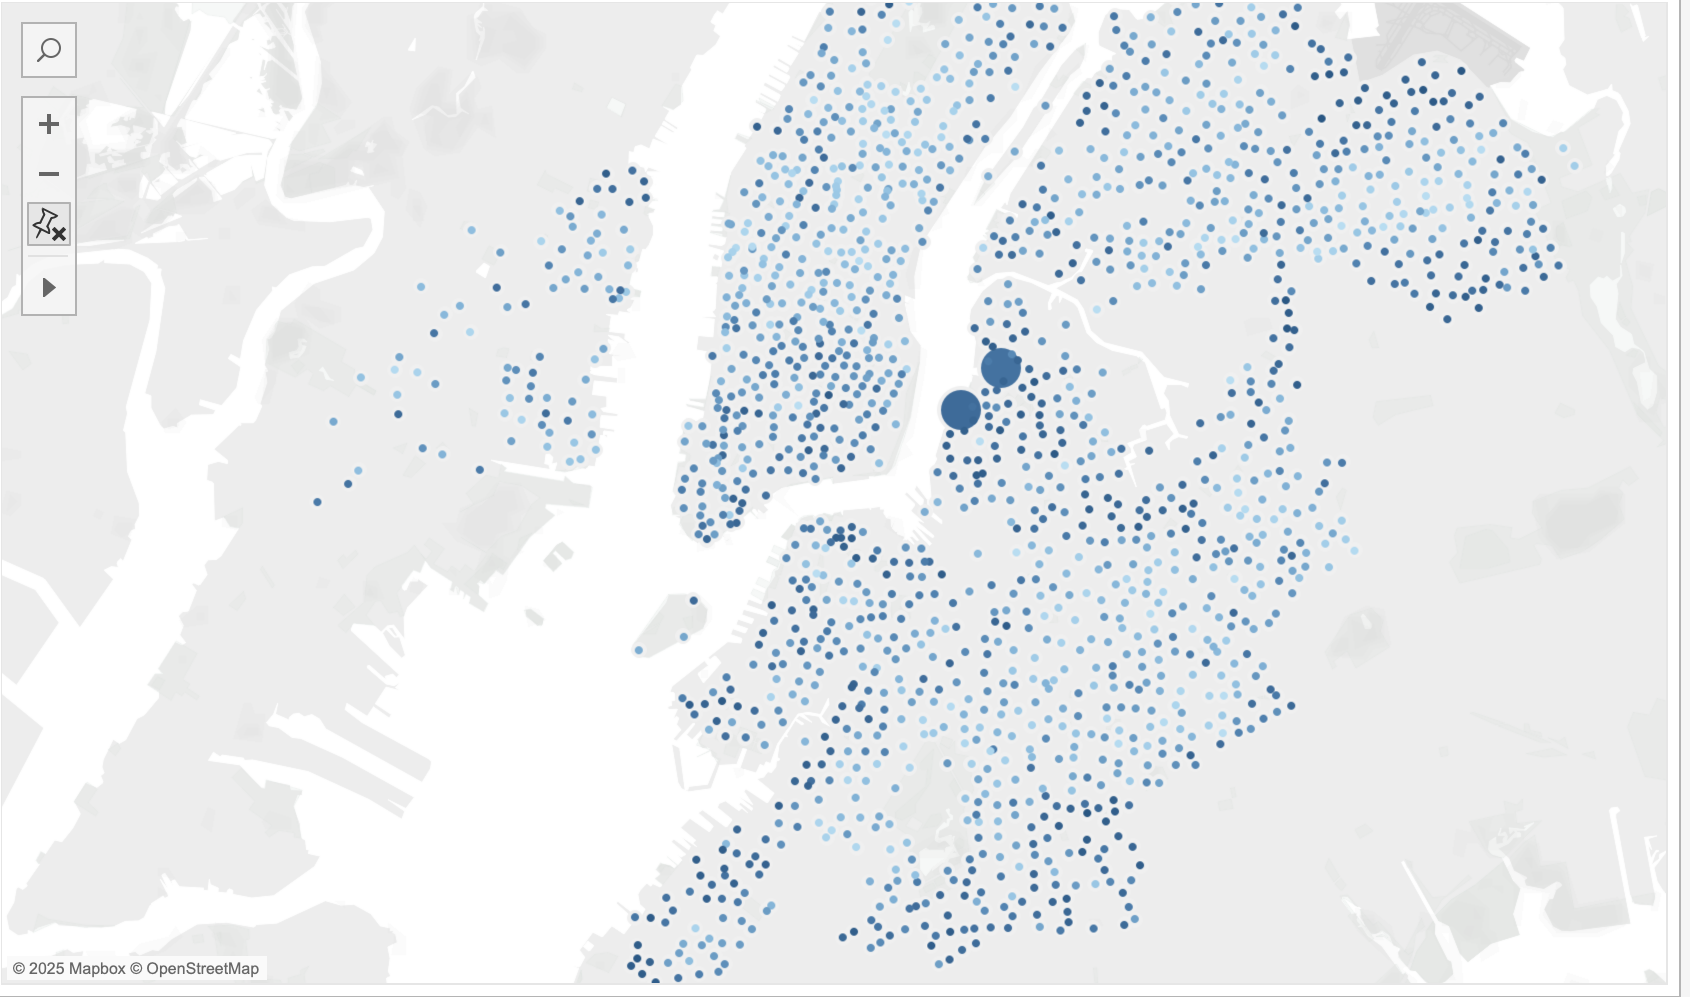
4. Detected Anomalies
Stations flagged by the anomaly detection algorithm for rapid state oscillations (full → empty → full) within short time windows, indicating operational instability requiring intervention.
Key Technical Decisions
Rule-Based vs. ML: Chose rule-based detection for interpretability and operational trust. Operations teams can explain flags during reviews and tune parameters without retraining models.
45-Minute Windows: Balances signal strength (distinguishes patterns from noise) with operational responsiveness (enables same-shift response).
Go + Python: Go for performance-critical ingestion, Python for flexible time-series analysis. Clear separation of concerns.
Operational Impact
Faster Response
- Before: Issues appear in next-day reports (12-24 hours later)
- After: Detection within 1-5 minutes
- Impact: Intervention during window when it’s still valuable
Targeted Interventions
- Before: Crews dispatched based on point-in-time snapshots
- After: Crews directed to confirmed behavioral instability
- Impact: Fewer wasted trips, higher success rates
Proactive Capacity Planning
- Identify stations with recurring patterns as candidates for dock expansion
- Data-driven evidence for capital investments
BI Integration
- Clean integration with Tableau, Power BI, custom dashboards
- Automated alerting via SMS/email for operational workflows
Technology Stack
- Go: Real-time API ingestion and processing
- Python (pandas): Time-series feature engineering and anomaly detection
- MySQL: Persistent storage with time-series indexing
- Jekyll: Version-controlled project documentation
Future Enhancements
- Predictive Models: Forecast instability based on time-of-day, weather, events
- Automated Alerts: Push notifications to rebalancing crews
- Severity Scoring: Weight by station importance and historical reliability
- Multi-City Deployment: Extend to other GBFS-compliant bike-share systems
Project Resources
GitHub: github.com/djbrown227/citibike_anomaly_detection
Author: Daniel Brown
Email: djbrown227@gmail.com
LinkedIn: linkedin.com/in/daniel-brown-203288146
Key Takeaway
This project demonstrates how real-time data engineering, domain knowledge, and operationally-focused design solve practical problems in distributed systems. It prioritizes usefulness over novelty—appropriate technical complexity to address real operational needs, with interpretable outputs that directly support decision-making.